Collect
Retrieve recent results for configured diseases and Mexican states.
Initializing portfolio
Roy.
Product · systems · impact
Case study · Jun–Jul 2026
I built the interactive map end to end—from news ingestion and dataset support to filters, fallback behavior and the state-level interface used to explore epidemiological information.

Overview
EpiCentro was created for ITRASIG as a complement to PABLO AI, the initial artificial-intelligence project, continuing the same mission of making epidemiological information more approachable. The wider product combines a news map, vaccination records, dose reminders and short educational activities.
My primary responsibility was the map: collecting and normalizing Google News information, supporting the dataset, exposing it through backend services and turning it into an interactive view across Mexico's states.
Core challenge
News volume is fragmented, repetitive and easy to misinterpret. The map needed to normalize sources, remove duplicates and present relative activity without implying that article counts were official case or incidence data.
The team included 16 people collaborating nationally and remotely. Communication gaps and limited access to the partner during some meetings required clear updates, technical guidance and deliberate integration work across feature teams.
Role
I worked as a full-stack developer in a 16-person national team. I owned the complete interactive map, contributed to its dataset and backend, supported the unified product integration and advised teammates on technical questions.
The complete EpiCentro application was a team outcome. This page focuses on my full-stack ownership of the epidemiological map and my supporting integration and technical-advisory work.
Architecture
Google News and RSS results provide recent articles associated with diseases and locations.
The API normalizes fields, removes duplicates, identifies topics and scores relevance.
Articles are aggregated into consistent state-level records with filterable activity information.
The interface renders Mexico, filters, state details, related articles and fallback data.
Workflow
The workflow turns inconsistent external news results into a stable response the interface can explain without presenting it as clinical evidence.
Retrieve recent results for configured diseases and Mexican states.
Standardize titles, sources, dates and links while removing repeated articles.
Detect topics, score relevance and aggregate relative article activity by state.
Filter the map, select a state, review its summary and open the original source.
Contribution
Decisions
The interface describes article activity rather than cases, incidence, severity or personal health risk.
The backend standardizes and deduplicates external results so the map consumes a predictable dataset.
Fallback data keeps the map demonstrable when Google News or the processing API cannot return a usable response.
State summaries lead to related article cards so users can review the publication behind each signal.
Deep dive
Data problem
External articles arrive with inconsistent text, dates, sources, locations and repeated results.
Engineering response
A backend pipeline produces state-level records that the React interface can filter and explain.
Product result
Users can explore all 32 states, switch diseases and activity levels, and review source-linked news.
01
Hover and selection connect the geographic view with a focused state summary.
02
Disease and activity controls update the information shown without changing the meaning of the signal.
03
Demonstration data preserves the primary workflow when live external services are unavailable.
Outcome
External validation
PABLO AI participation certificate
July 10, 2026
Dr. Octavio P. García González · President, ITRASIG, A.C.
ITRASIG recognized my participation in PABLO AI, its initial AI project. EpiCentro was developed as a complementary product that extends the same public-health information mission.
Read the redacted participation certificateLessons
Evidence
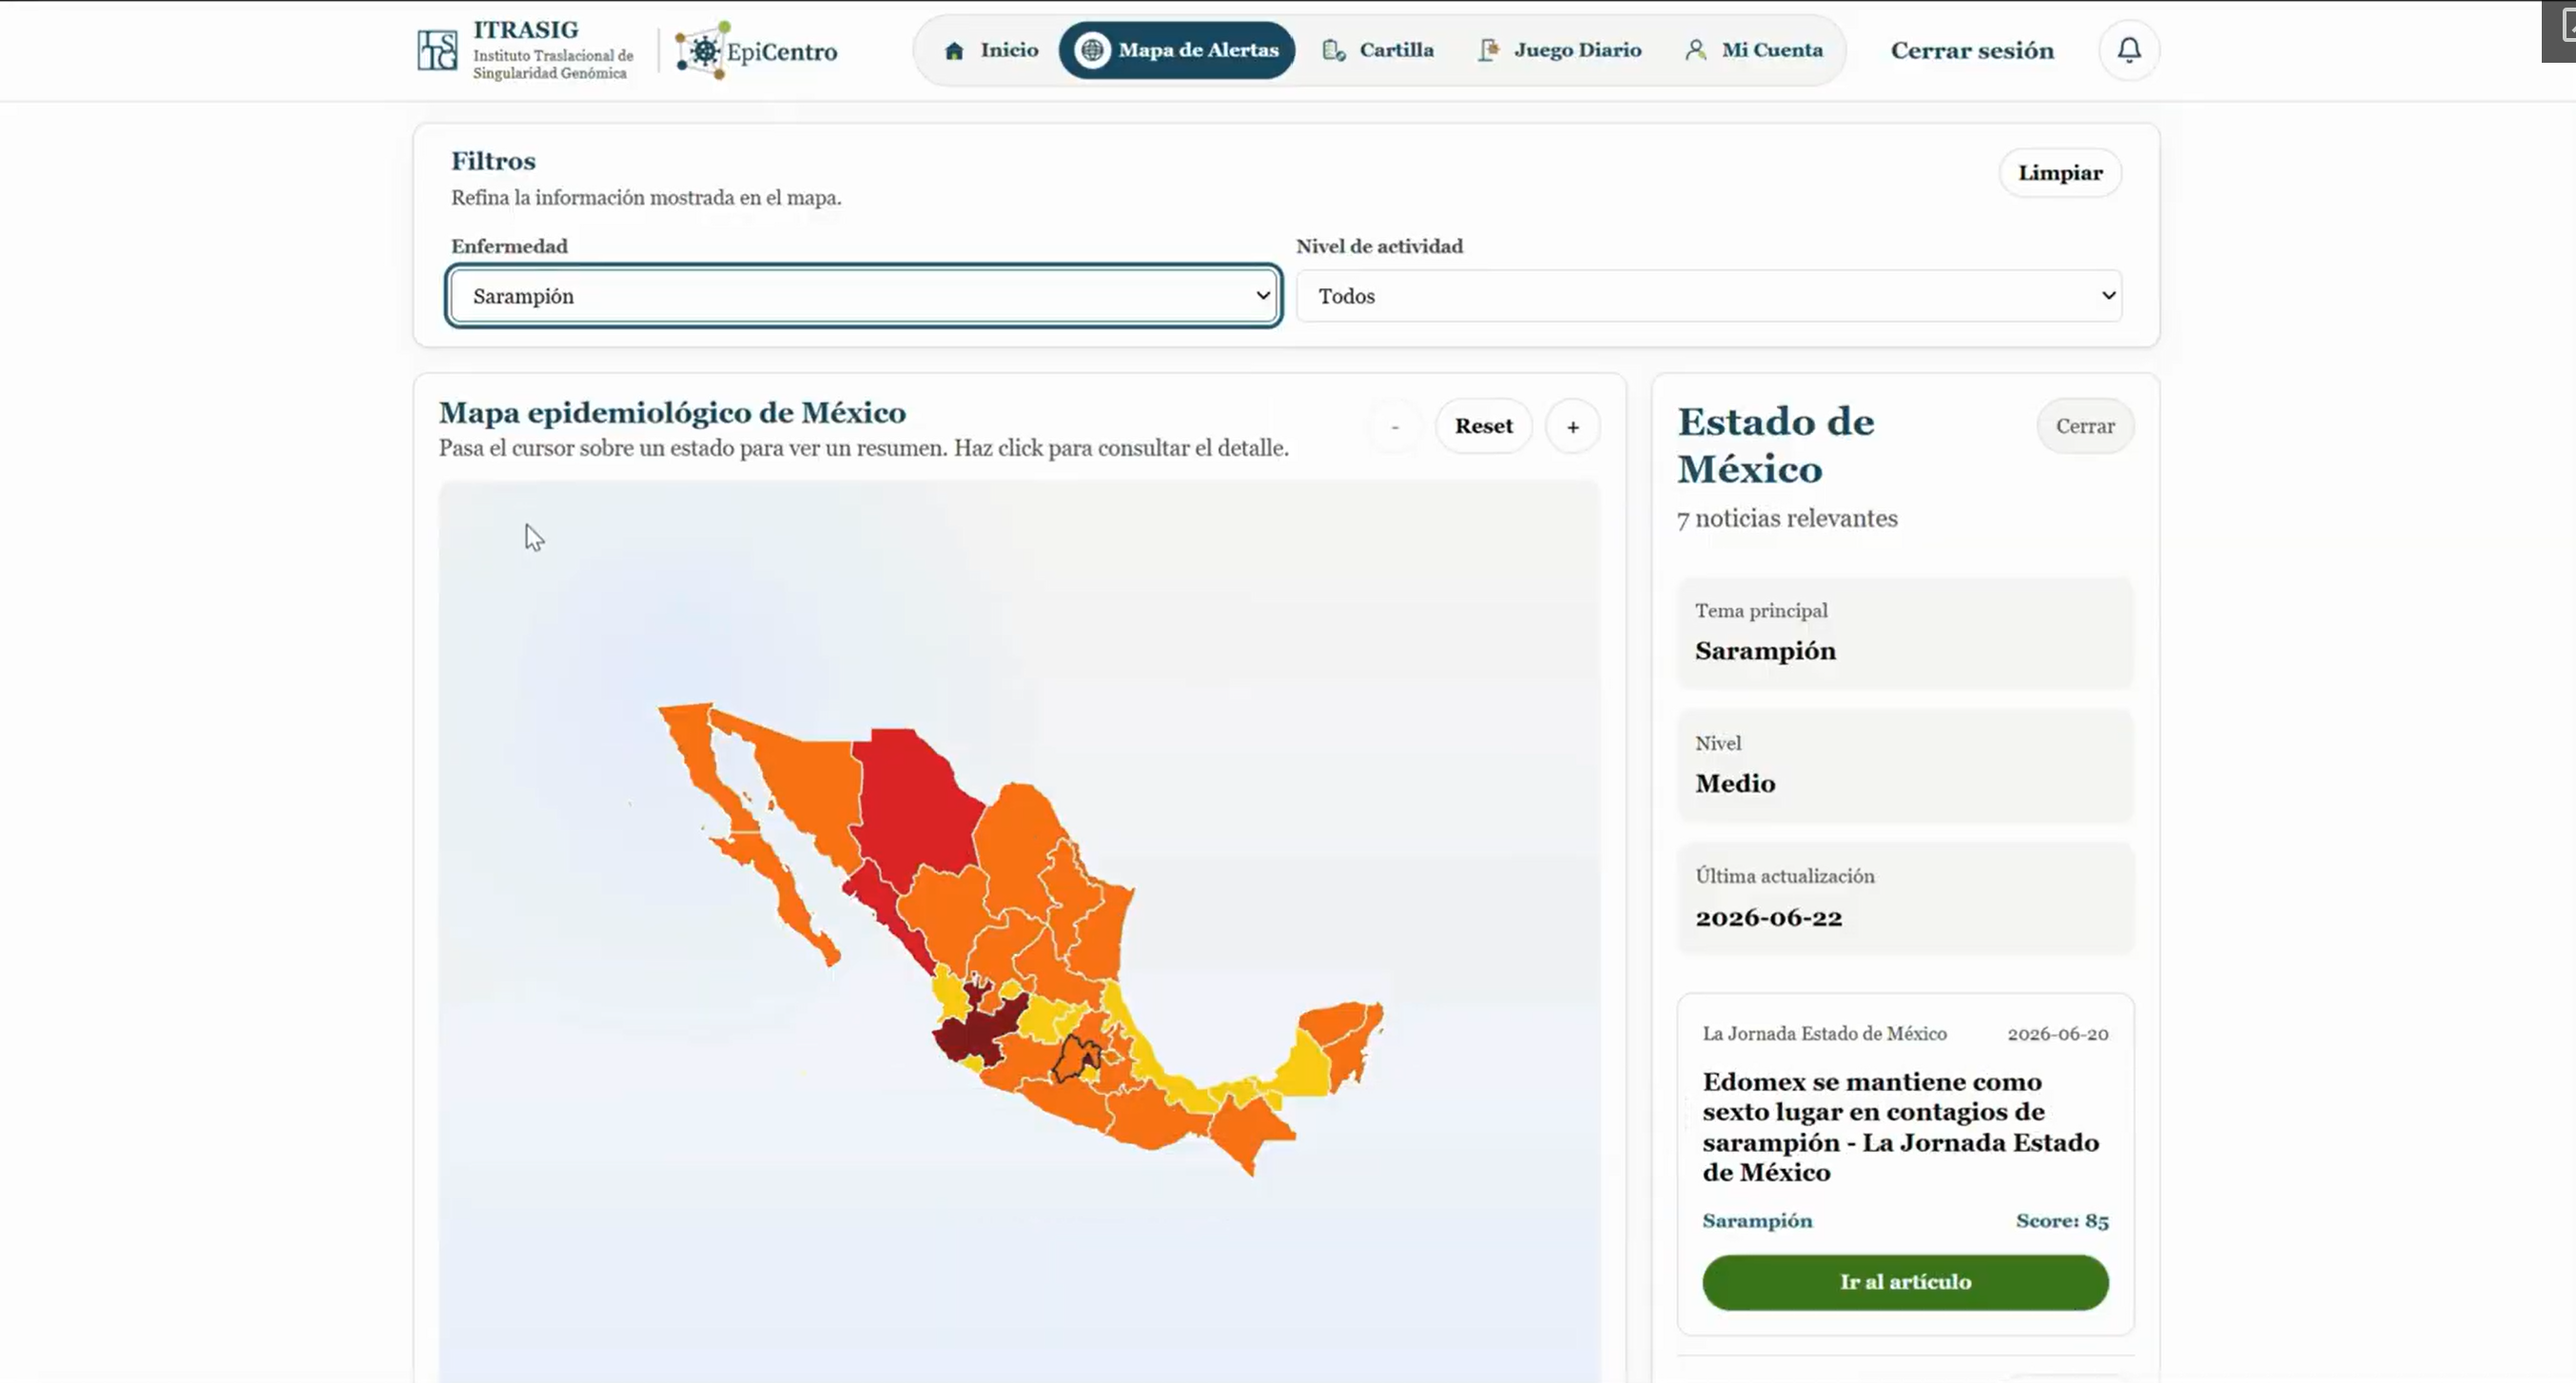
State-level exploration
Disease and activity filters refine the map while the selected state panel explains the signal and links to its source.
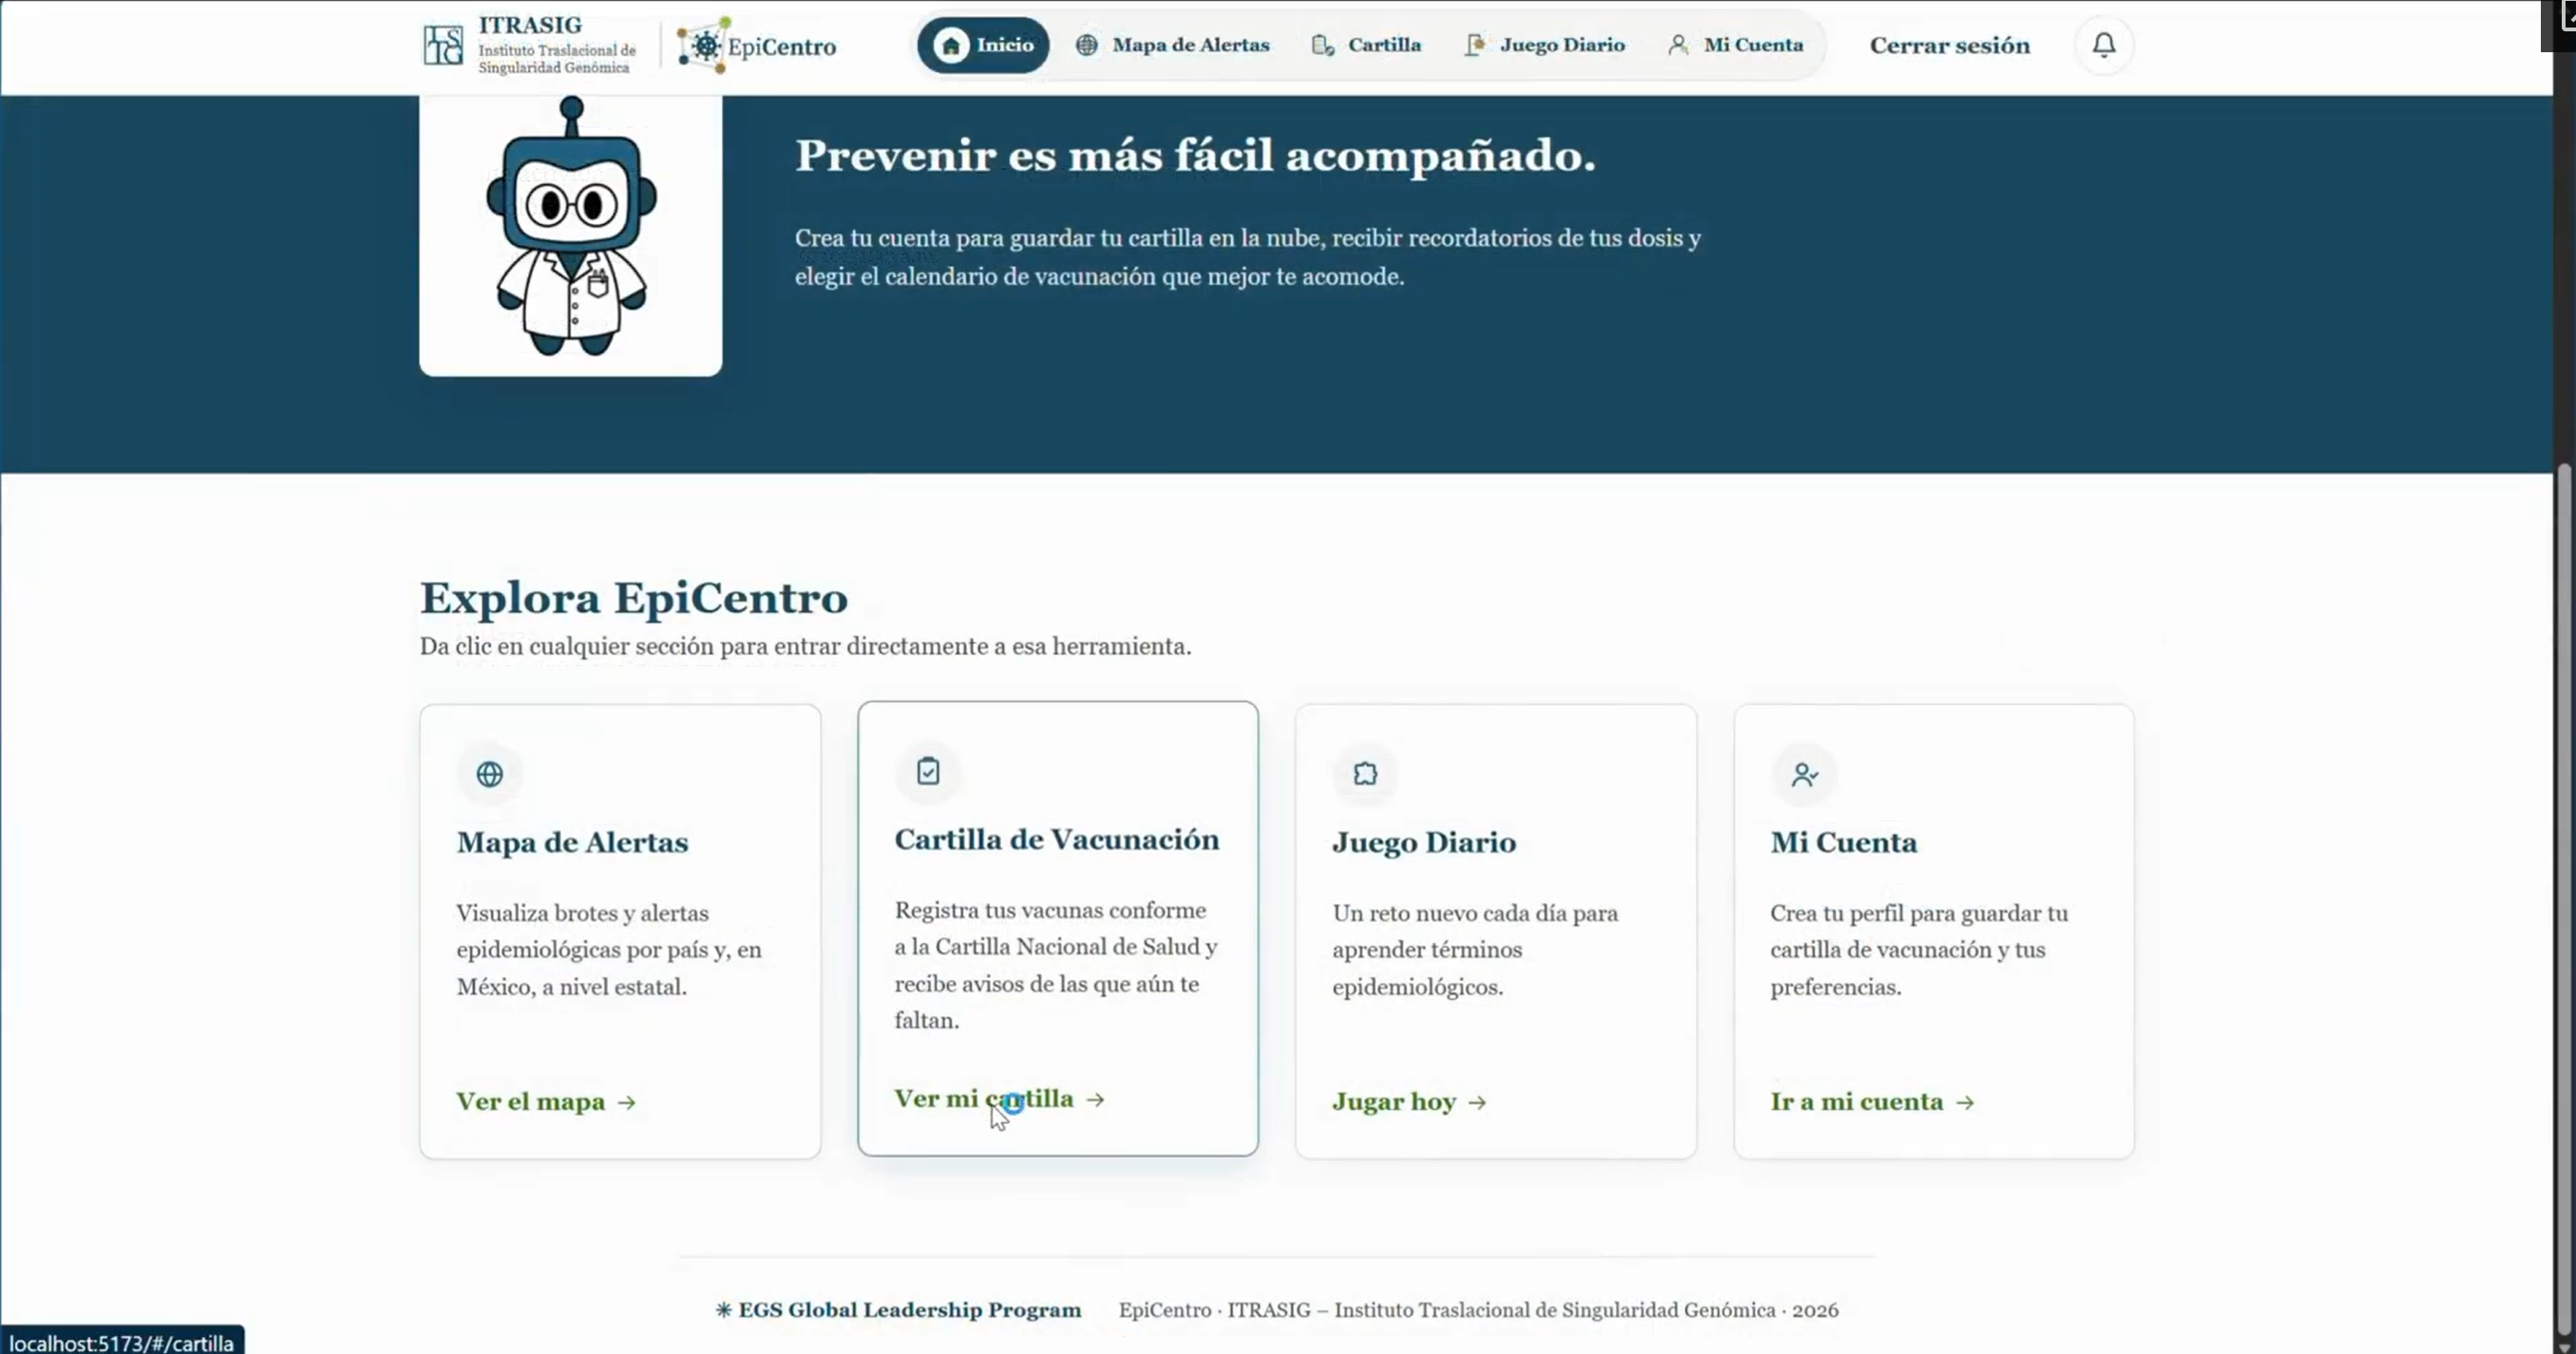
EpiCentro main page
Full resolutionMain page for accessing the map, vaccination records, dose reminders and educational activities.
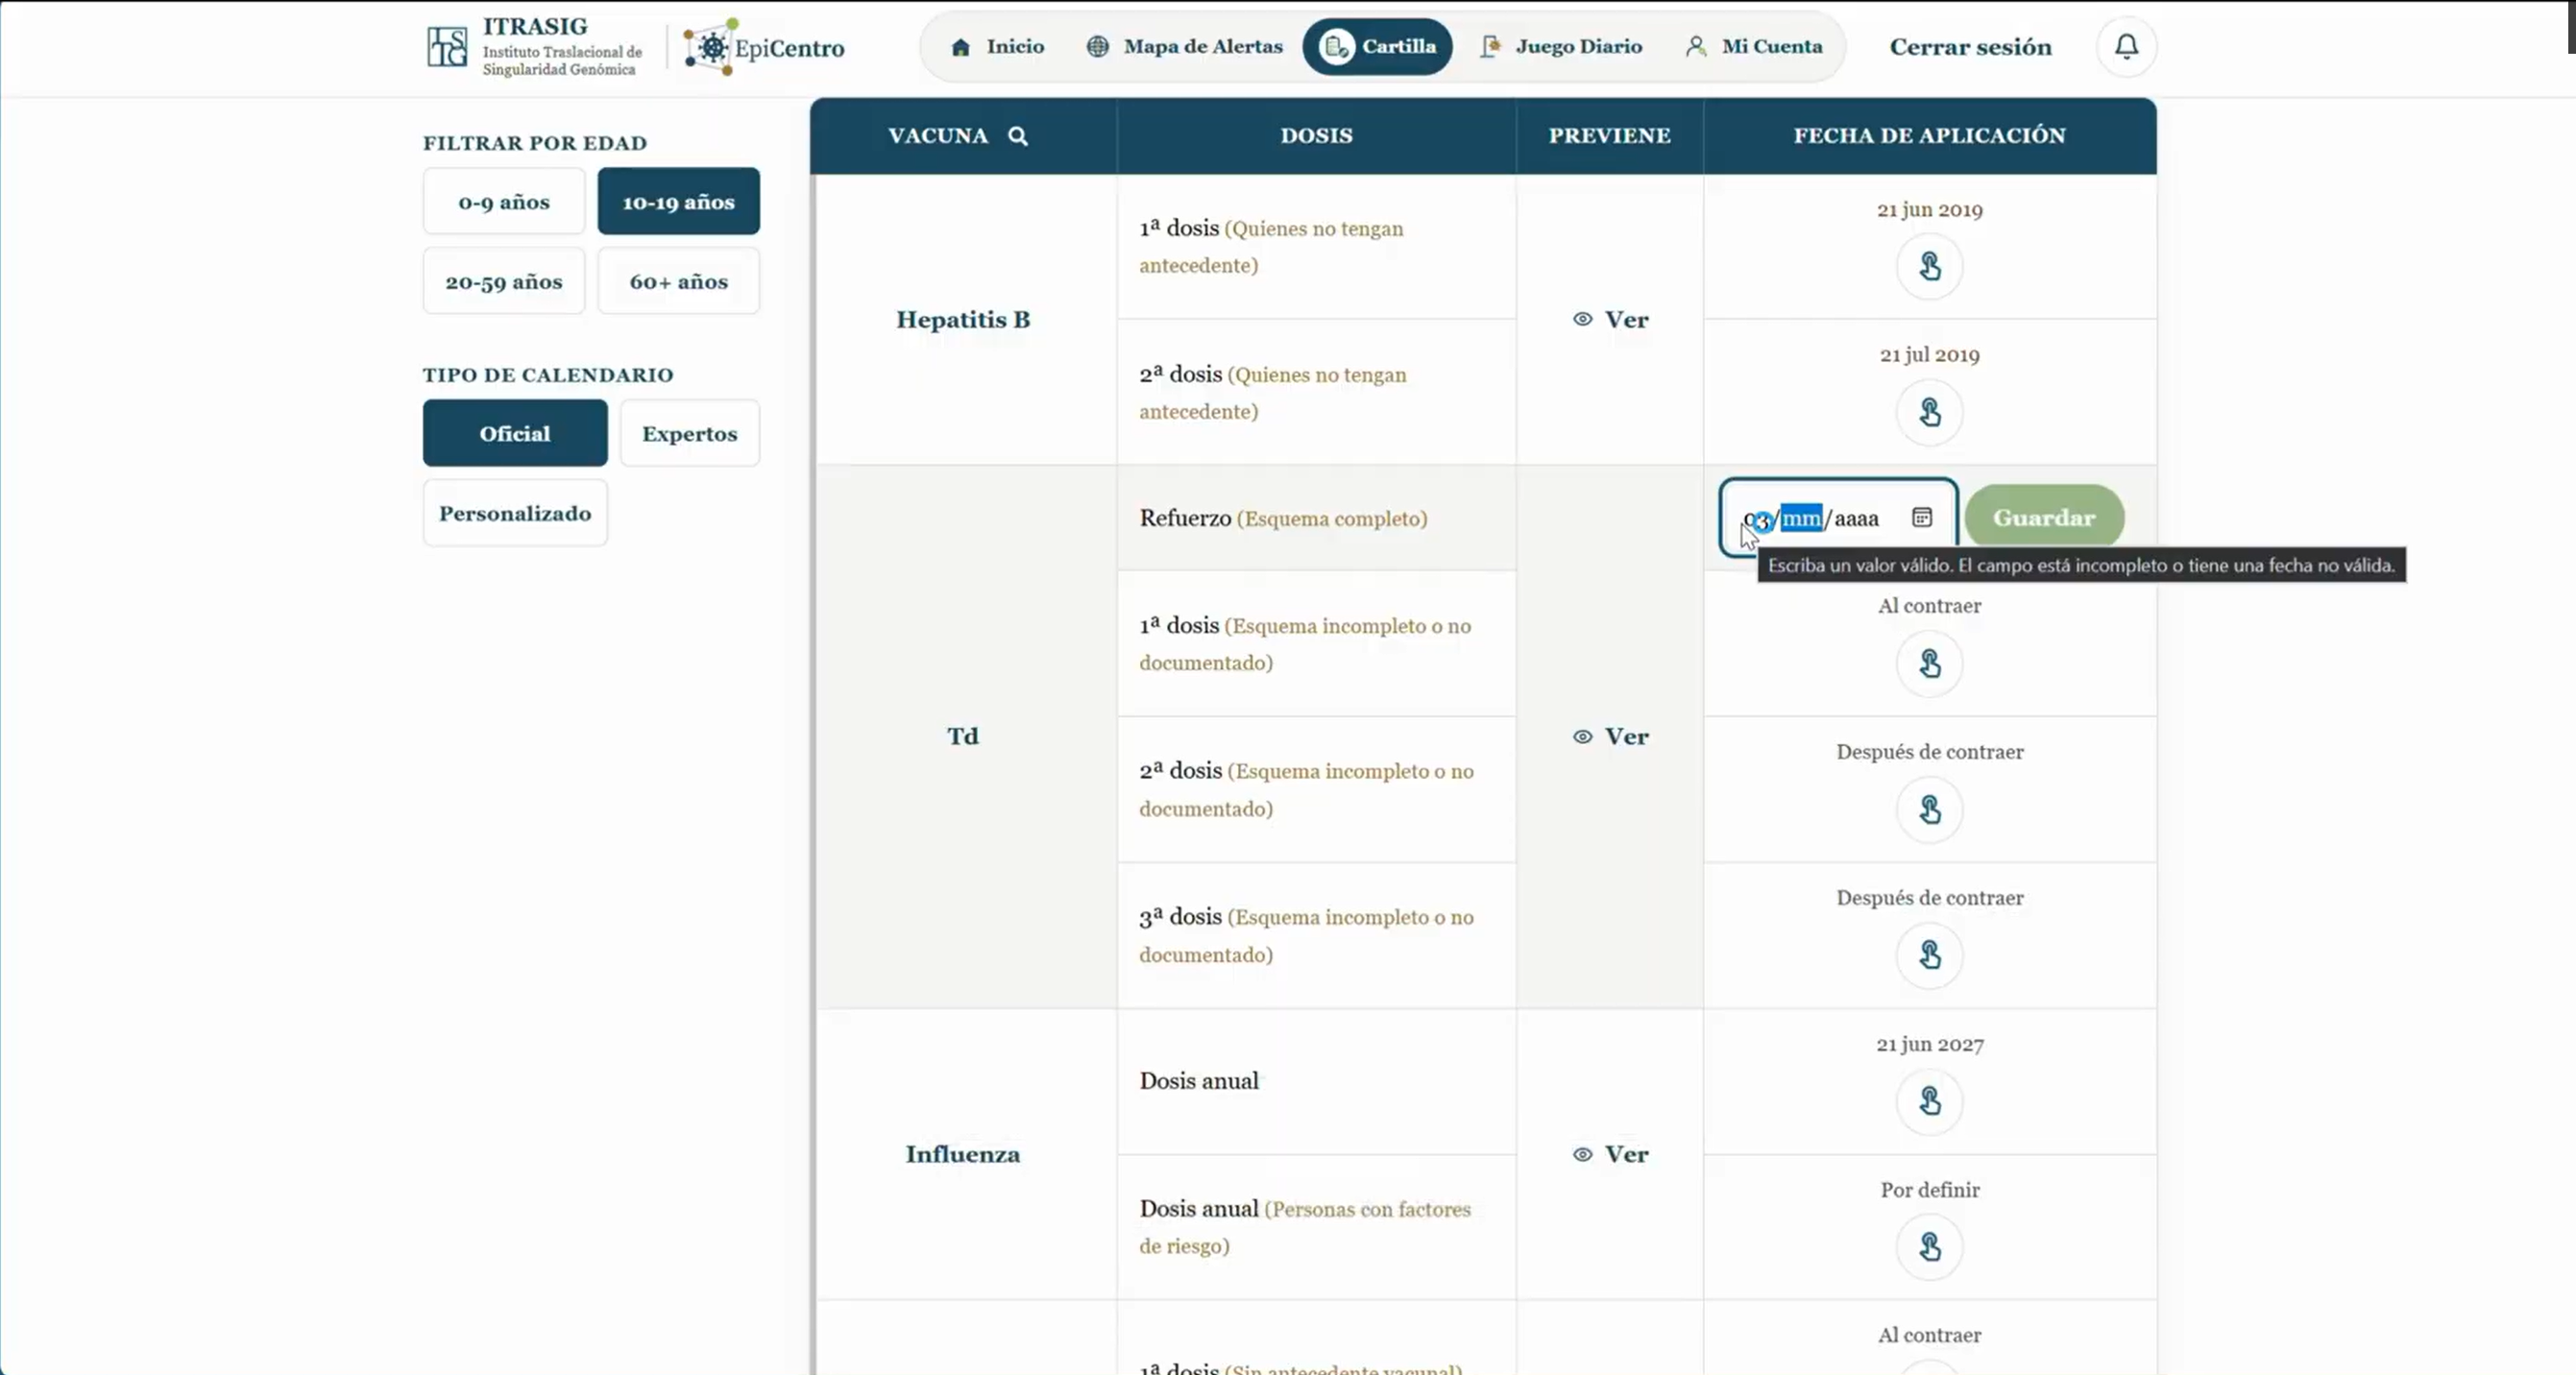
EpiCentro digital vaccination record
Full resolutionPreview of digital vaccination records area, where users can view and manage their vaccination history.
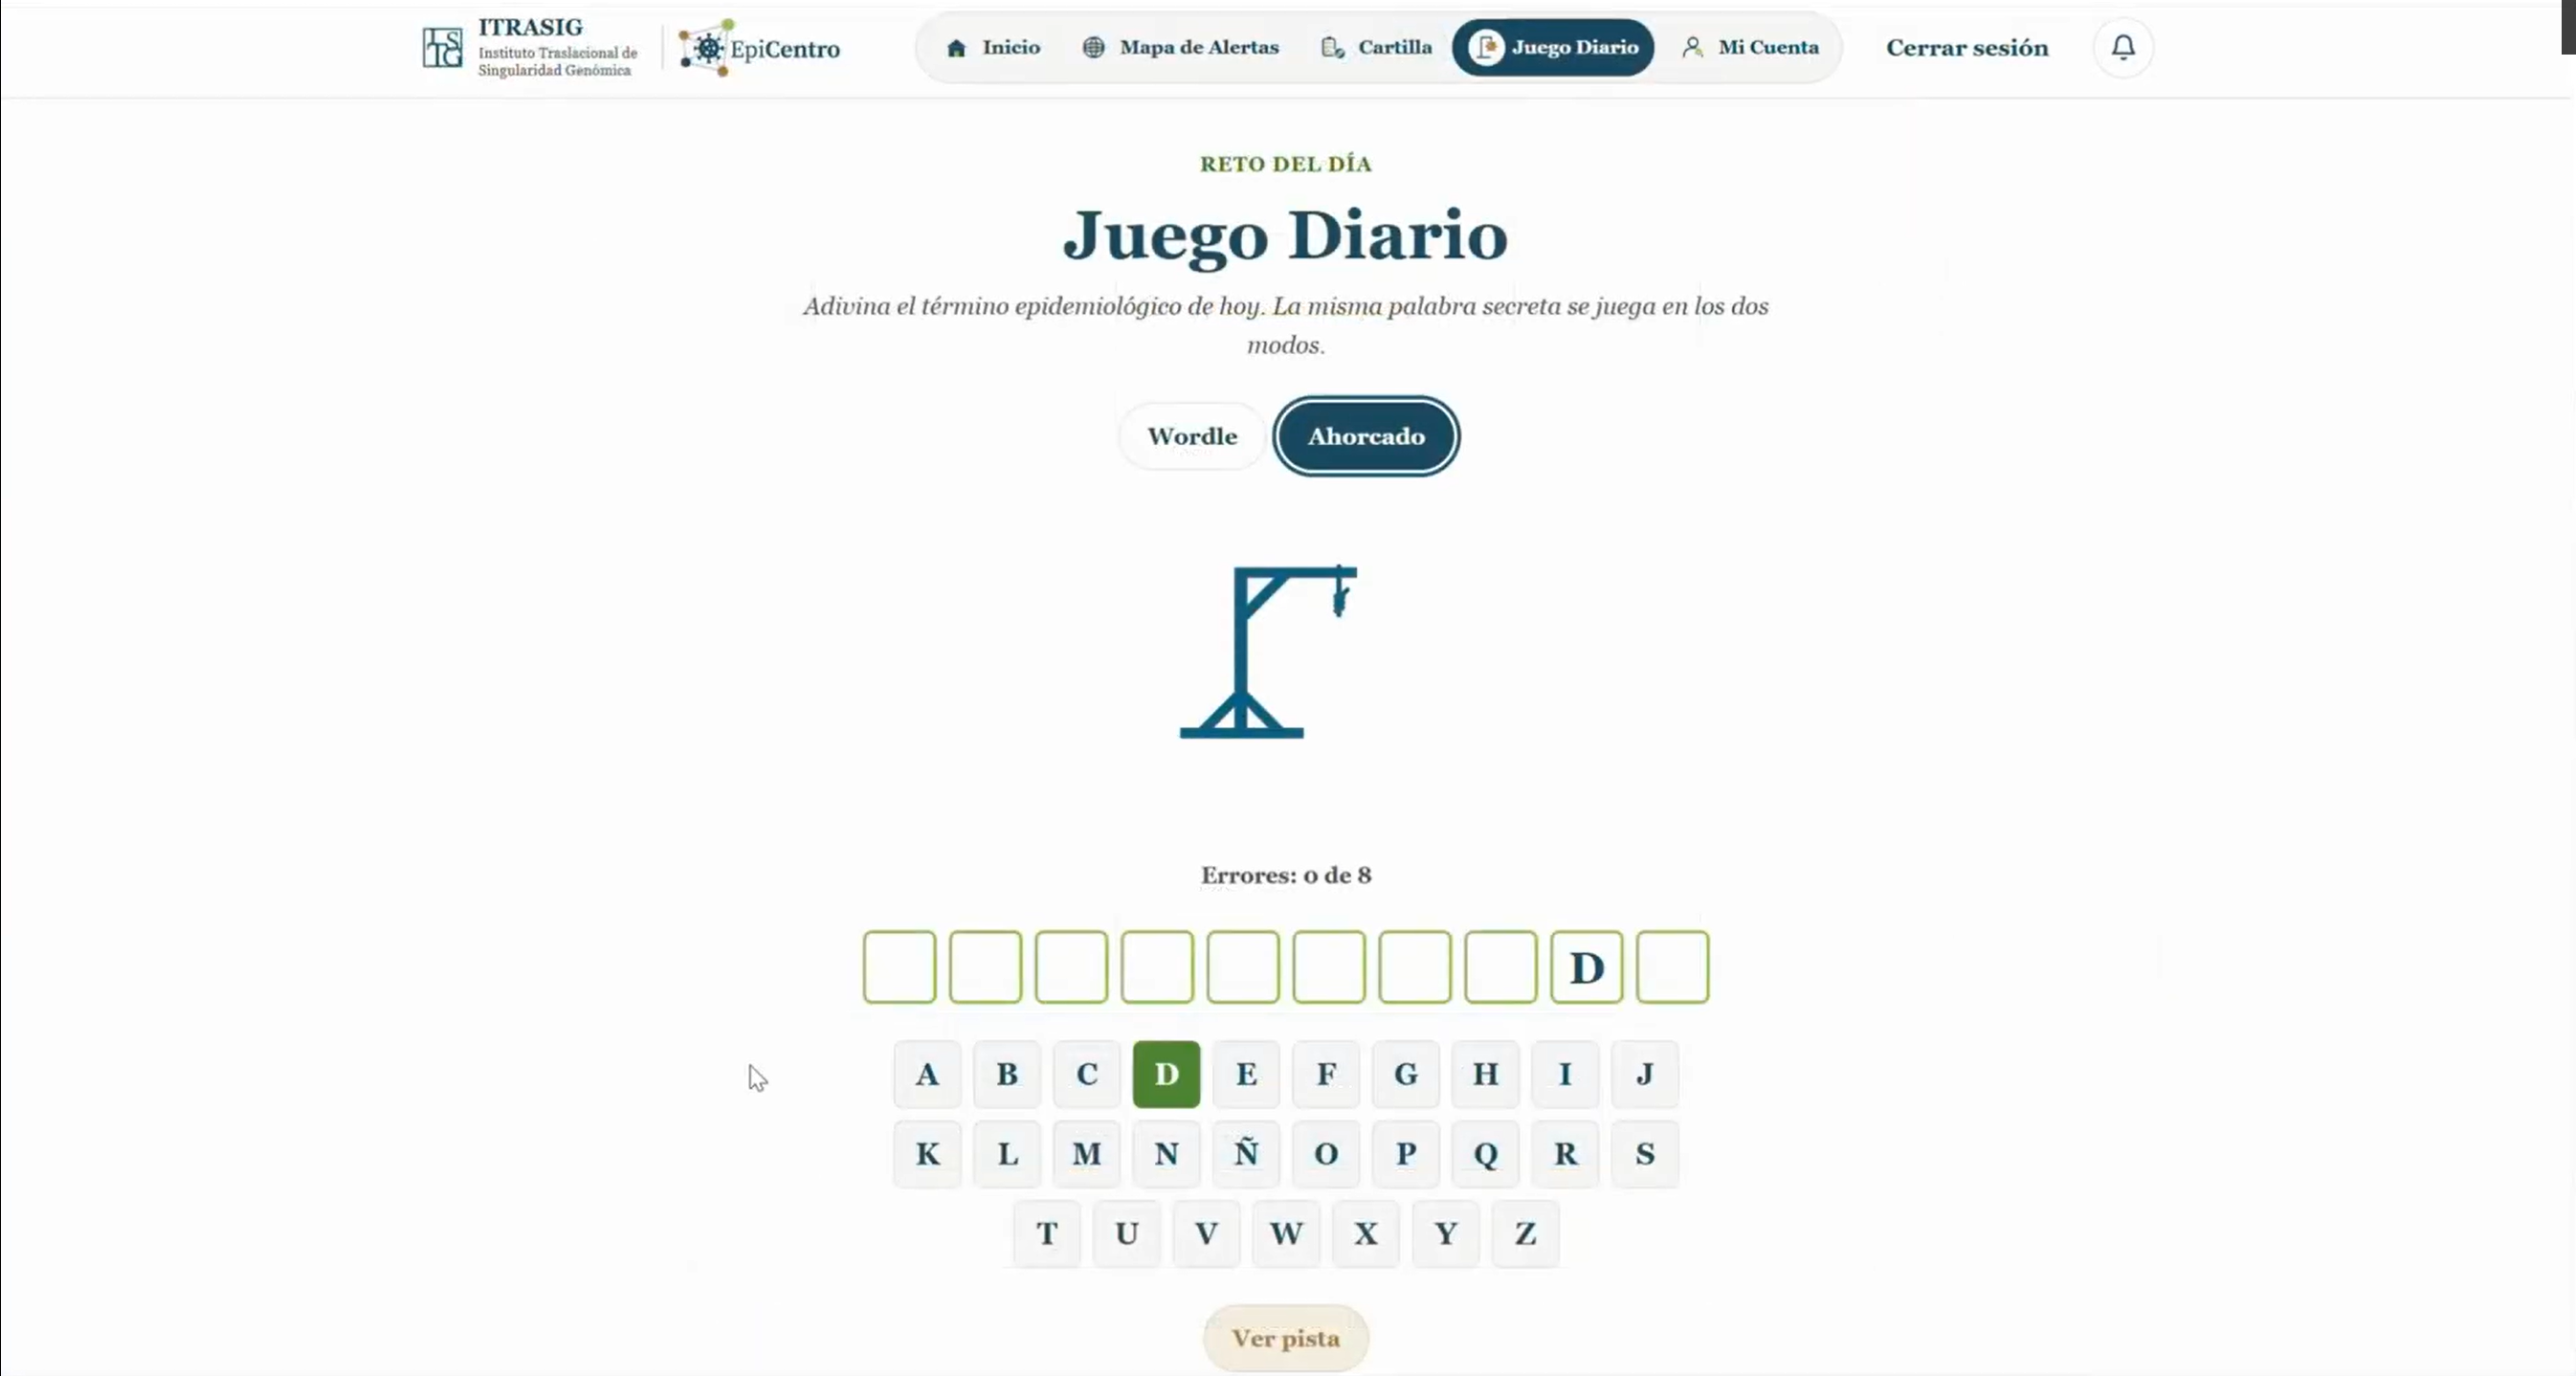
EpiCentro daily game
Full resolutionPreview of the daily game feature, where users can engage with health-related challenges and activities. It can be a Wordle or a hangman game.
Attribution
EpiCentro was completed by a 16-person national team for ITRASIG. The map screenshots and product description are shown with permission. Source code, personal health data, internal datasets and infrastructure remain private.